CSEL SCIENCE
Strategically Use Multimodal Supports.
Comprehension depends not only on specialized vocabulary but also on additional supports that help students make sense of science content and specific phenomena (NGSS Lead States, 2013; National Research Council, 2012). CSEL Science uses visuals, including multimedia (e.g., short videos, GIFs), labeled illustrations, and graphic organizers. Linguistic supports include teachers modeling thinking, performance, and language associated with scientific practices. CSEL Science ensures that curricular materials are available in digital formats (e.g., Google Docs and PDFs) compatible with device- and browser-based accessibility tools, such as text-to-speech and screen reader applications. For many students, the combination of spoken and written words is beneficial, in part because some students struggle with reading fluency.
Use of Media to Support Conceptual Understanding
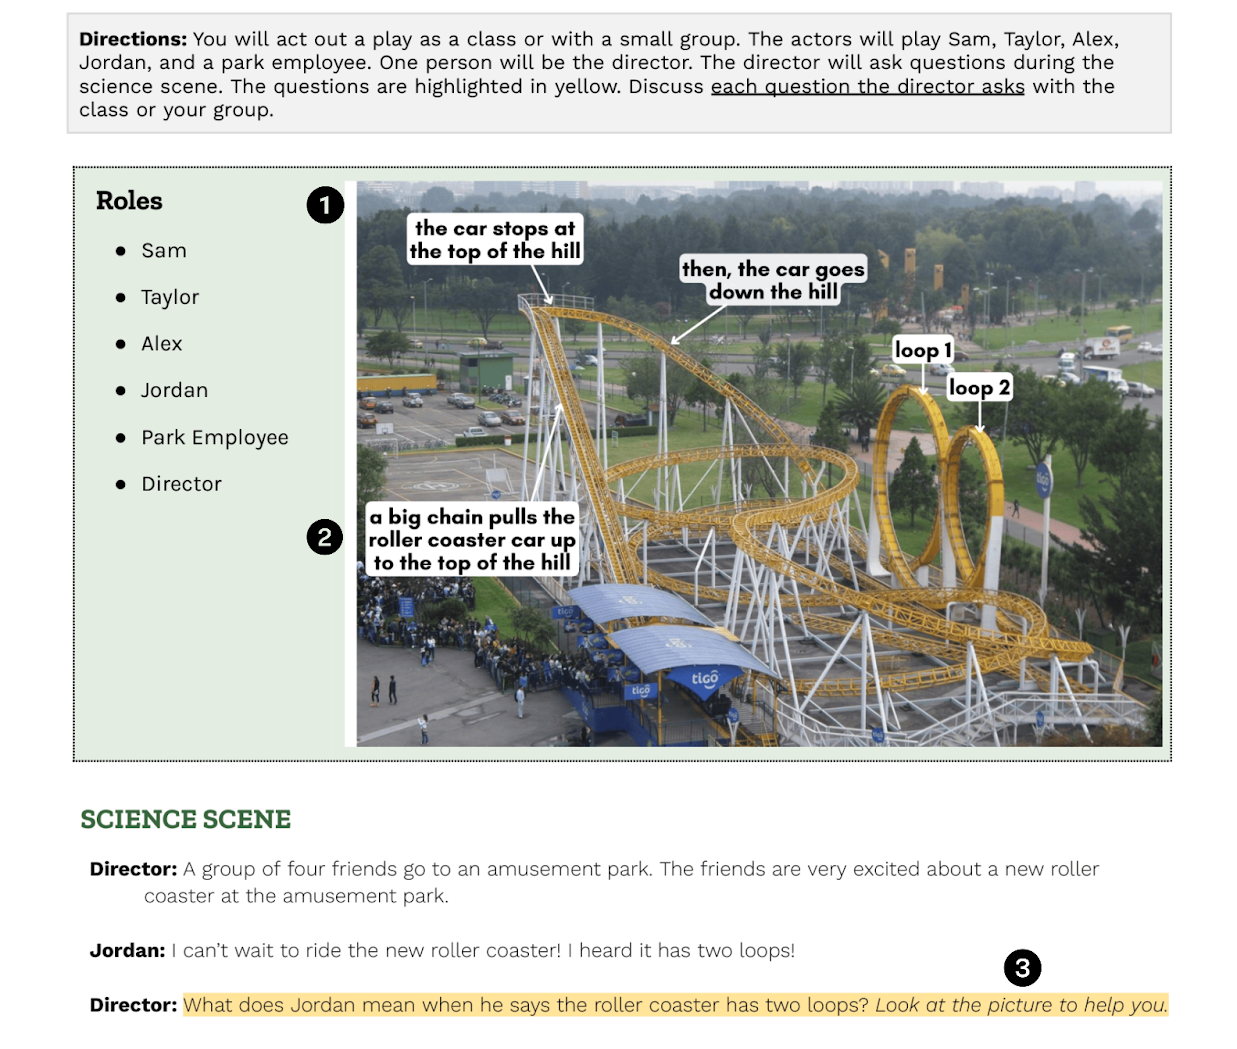
1
The science scene introduces the overarching phenomenon: a roller coaster that lacks sufficient energy to go through the loops. An image is provided to help students visualize the problem and answer the director’s question.
2
The image includes labels that identify key elements helping students connect visual cues to vocabulary and scientific concepts. Key elements include numbered loops and information related to how the roller coaster travels up and down the hill.
3
The image is referenced in the science scene to support comprehension. Students use it to understand key terms (roller coaster, loops) and the problem presented, making it easier to follow explanations and analyze the problem.
The image below shows a labeled image from Session 3.1:
Roller Coaster Rescue, along with part of the associated science scene. In this activity students act out a play and answer questions related to the play. Numbered circles highlight key features and are described below.
Graphic Organizer
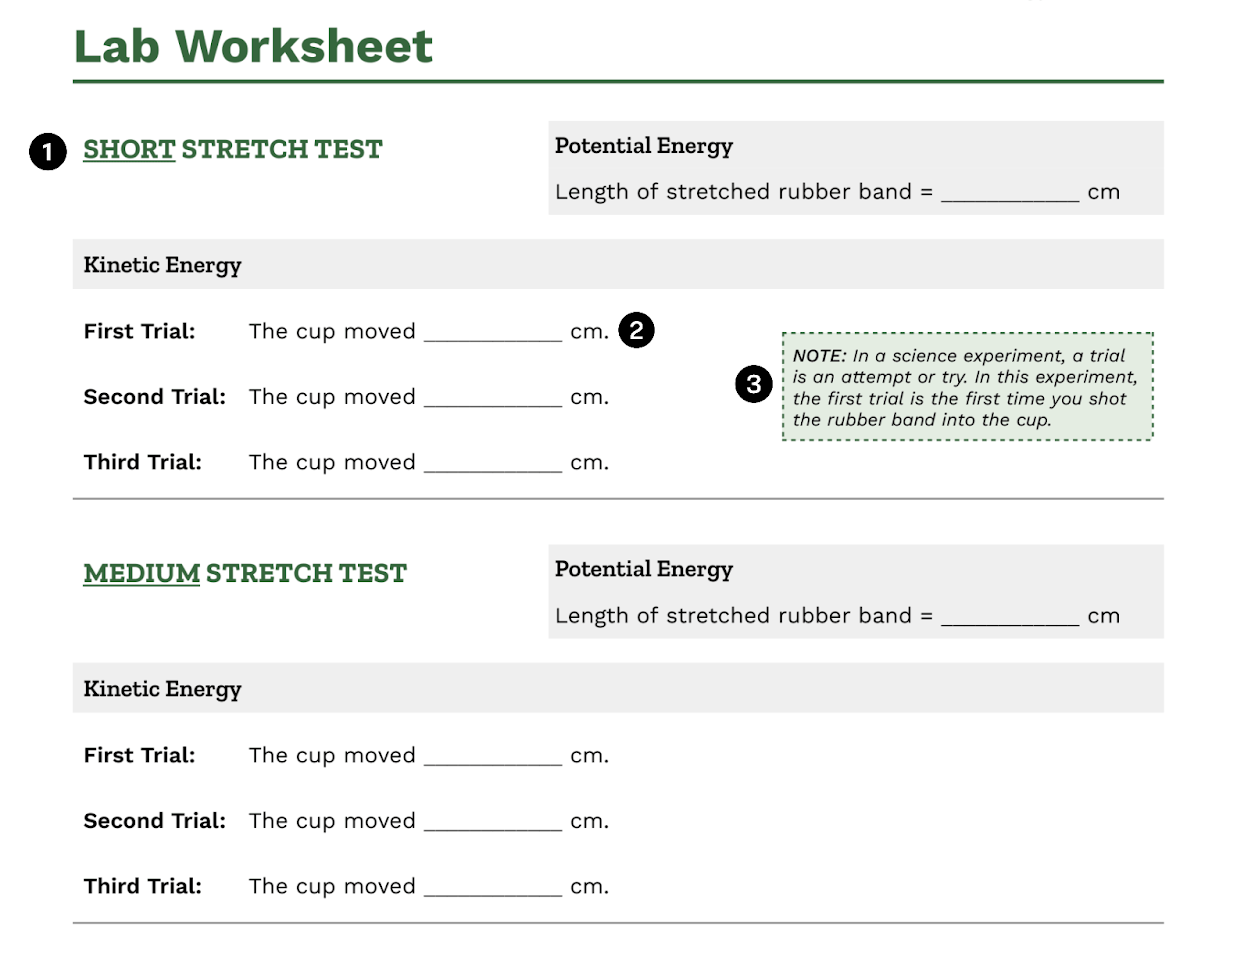
Description of key features highlighted:
1
A graphic organizer provides a structured framework to help students collect and record data during hands-on investigations.
2
The graphic organizer models standard data collection conventions, including the use of units (e.g., cm) and clear labeling. This modeling reinforces good scientific habits and helps students understand how to communicate their findings accurately.
3
Green “science note” boxes provide helpful contextual information or clarify science terms, practices, or tasks that students may need to better understand the content. For example, a note might explain what a “trial” is in an experiment or how to interpret a measurement.
The image below shows part of a graphic organizer used for data collection during Session 5.4:
Elastic Energy in Action. Numbered circles highlight key features and are described below the image.